Optimizing income of your farm using Fibonacci
This is something that has been on my mind for a long time. So many growers ask me what is the best combination of crops to grow to get maximum income. It is impossible for me to answer that and I don’t think any economist can do so either. Unless you spend a lot of money on a business analysis, you will get an answer, but over a couple of years that answer will change too. So how can you know that you are doing things right.
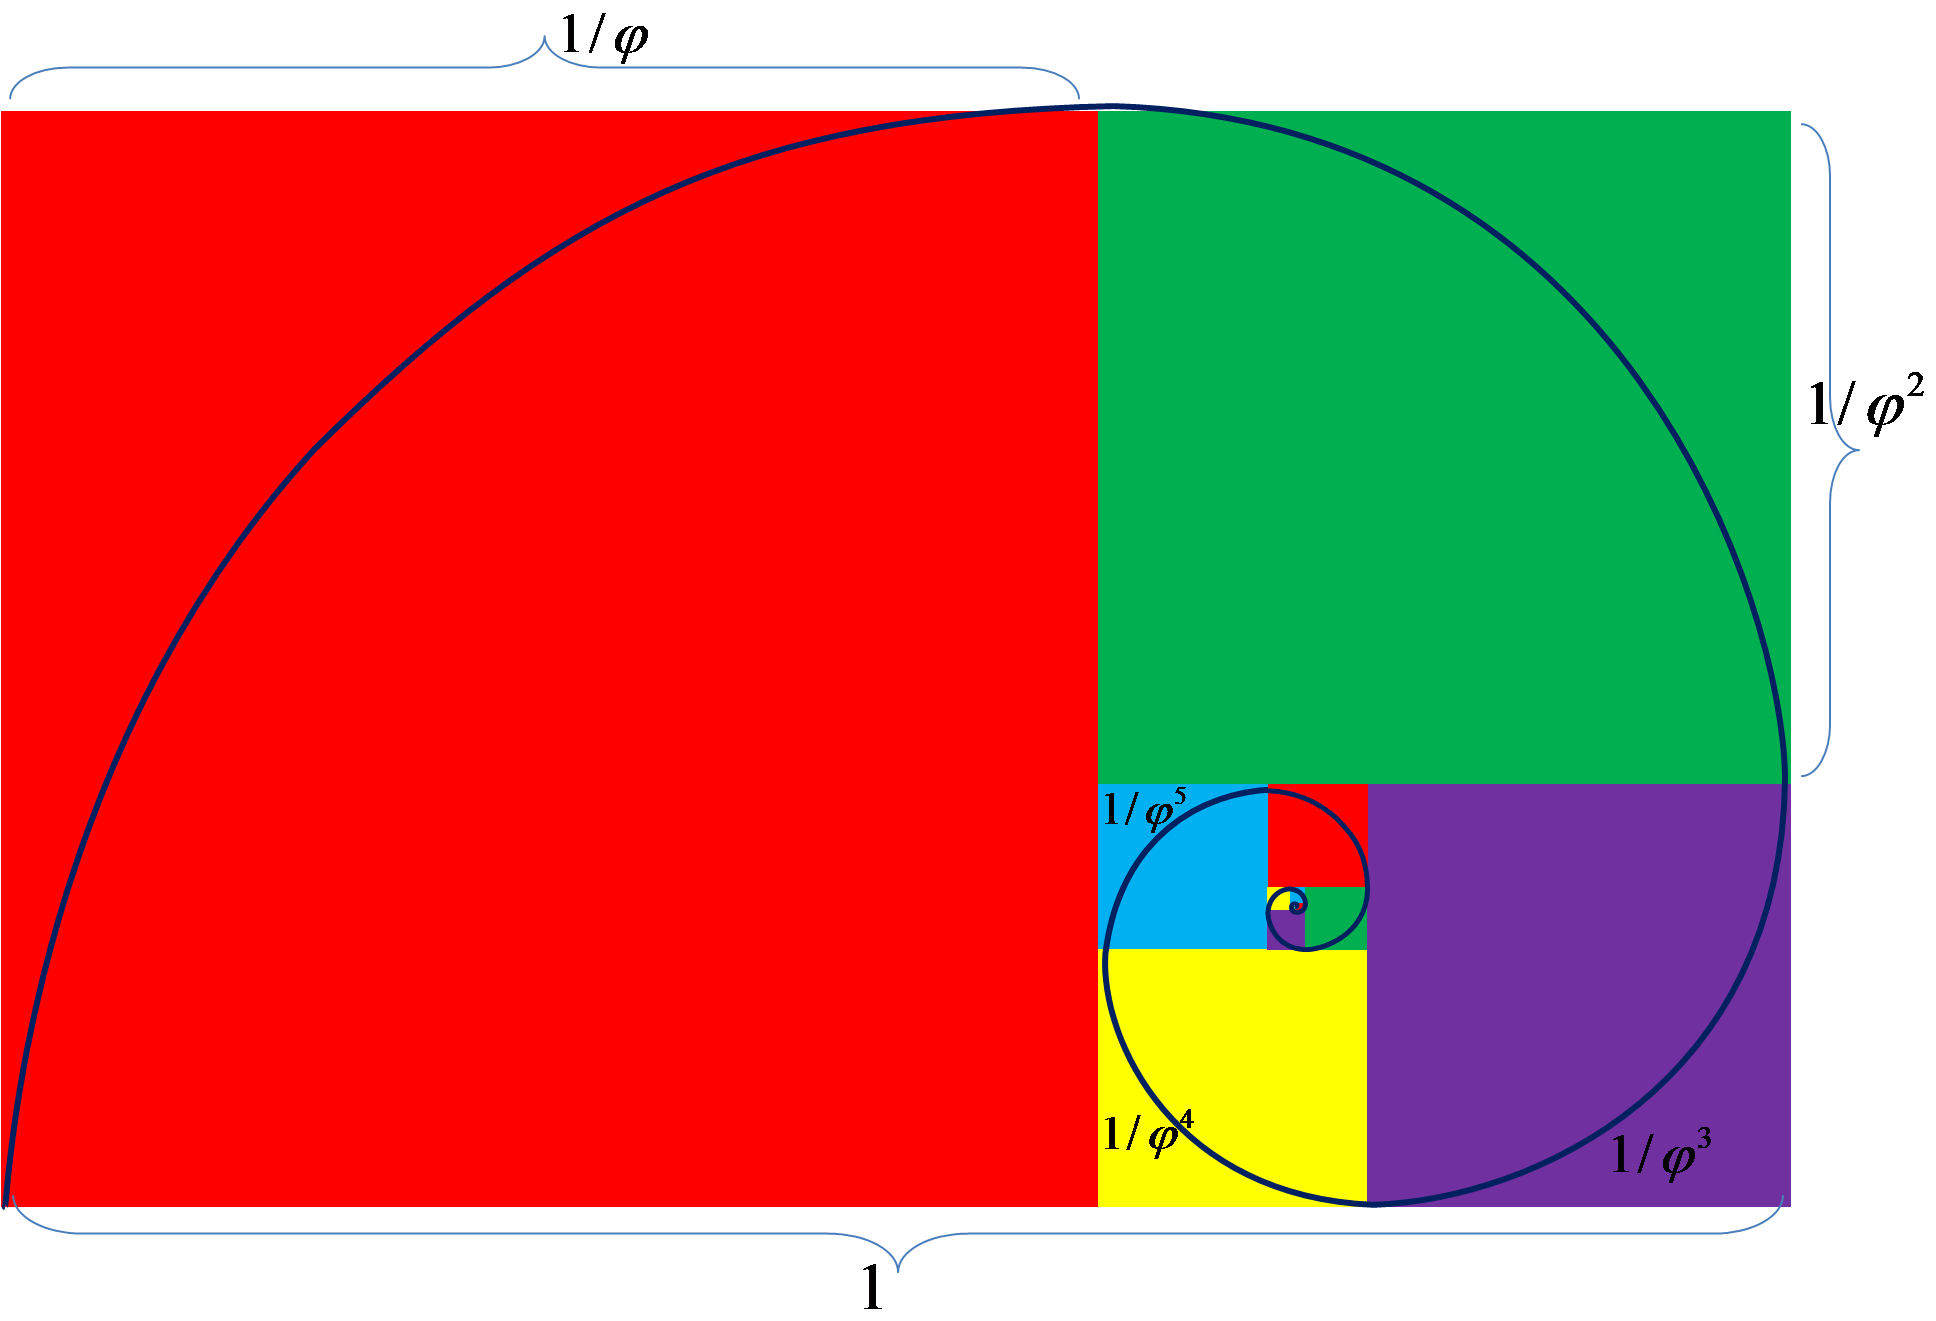
I will cut to the chase right from the start. I think one can reach close to optimum production by looking closely at your market potential and growing for that demand according to the Golden Rule of Fibonacci curves or rectangles (See the featured image) 1https://commons.wikimedia.org/wiki/File:Golden_Ratio.png Sound very mathematical but it is not.
What is Fibonacci Golden Rules?
First, there is nothing mystical or golden about these rules. It’s just fancy names, but it is all about a ratio that is found throughout nature. If you take a rectangle with the length of the long side divided by the length of the short side and you get 1.618033988 …, you have a golden rectangle. This specific number has a name called phi and has its own little symbol φ.
So, in the diagram below: a ÷ a1 = 1.618, or a1 ÷ c = 1.618 or a2 ÷ c2=1.618.
If you look carefully, you will see 5 golden rectangles in the diagram below. Each fit perfectly into the other with the same ratio’s. I am not going to discuss all the applications of this mathematical formula but a very good site to learn more can be found at Sciteneg.
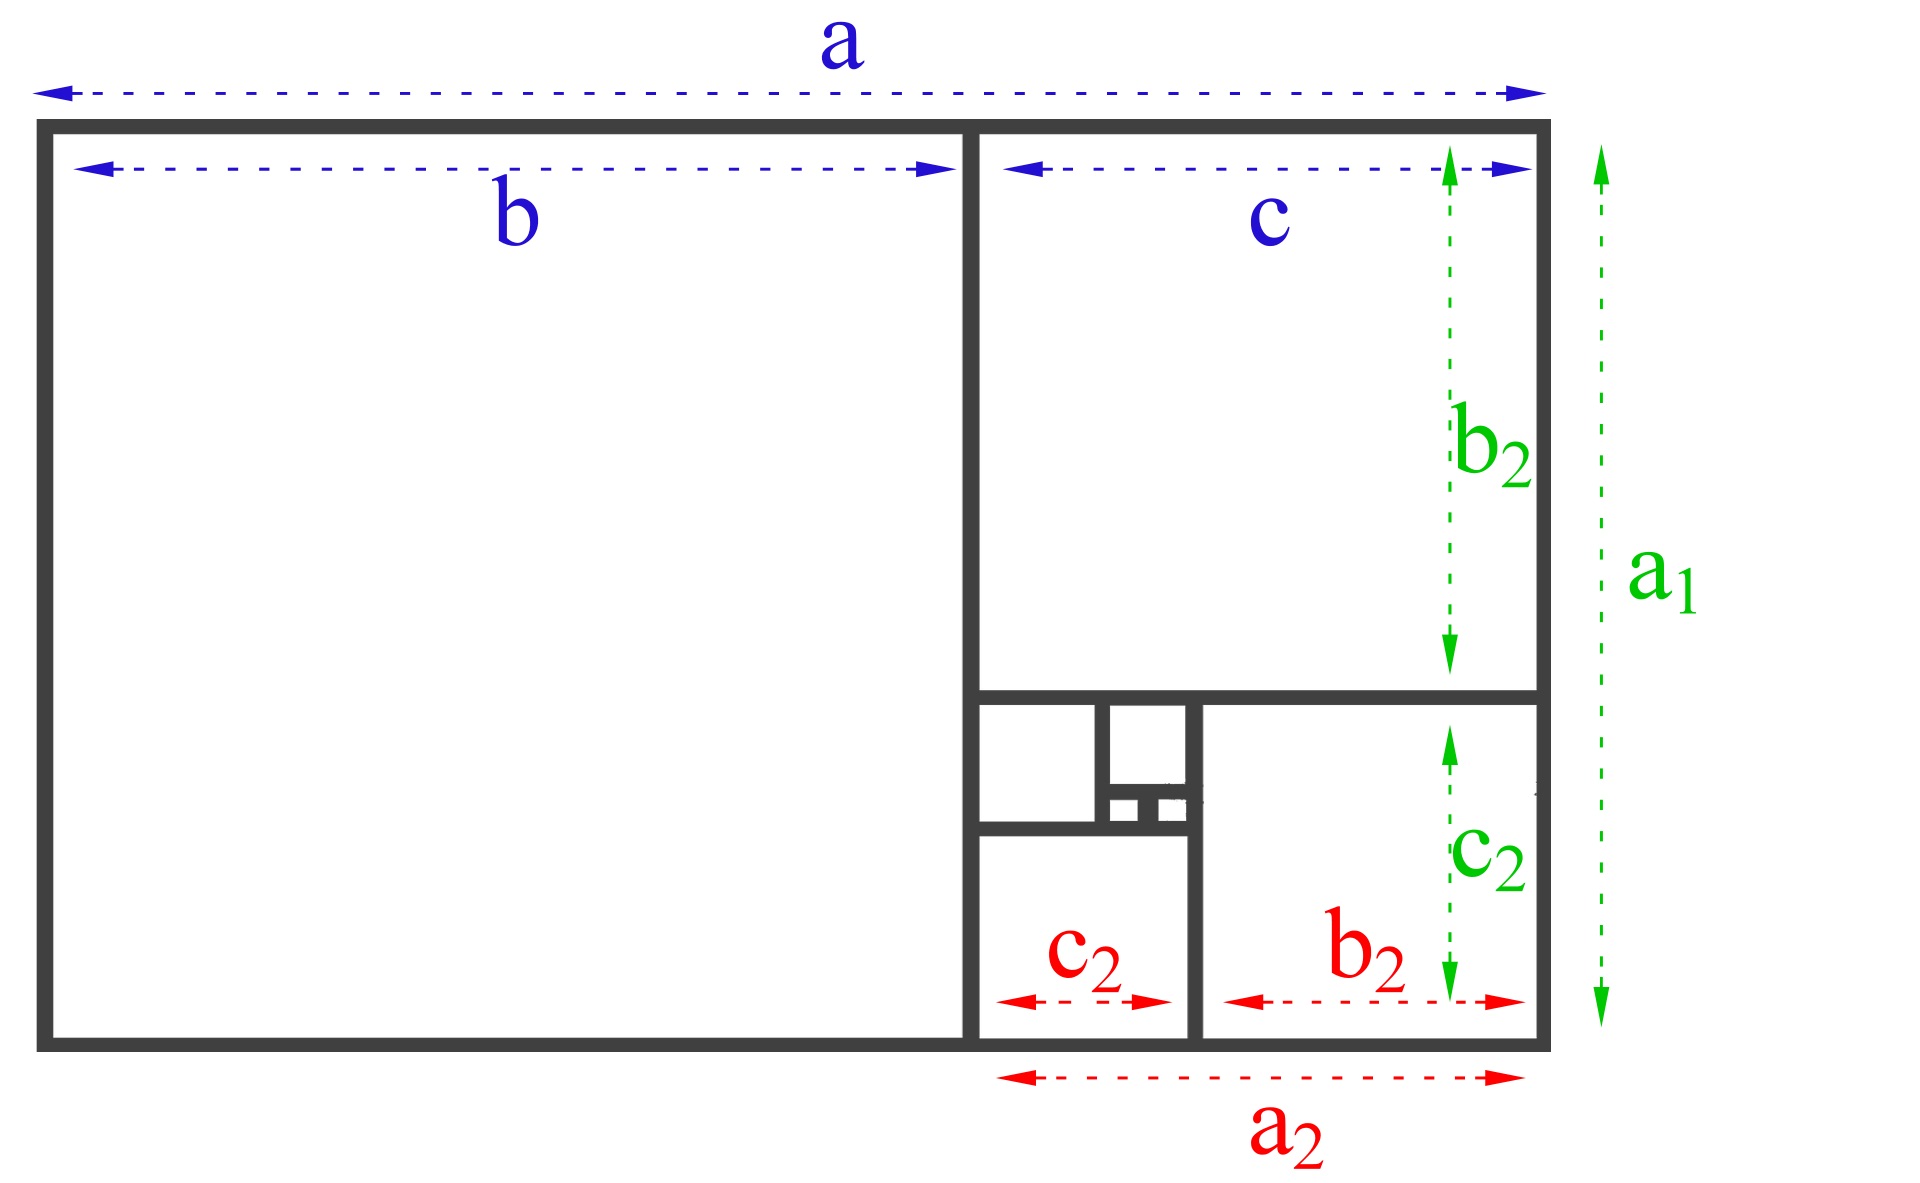
Fibonacci triangle. If you take a rectangle with the length of the long side divided by the length of the short side and you get 1.618033988 …, you have a golden rectangle.
So, what has Fibonacci and rectangles to do with farming?
Well it’s got to do with the ratios of each block in this golden rectangle. And remember, for it to be a golden rectangle the length of the long side divide by the length of the small side must be 1.618 …
Now don’t get confused as I am about to confuse you 🙂 Read carefully.
If you have the golden rectangle. Not just any rectangle, it must be the golden rectangle, something ‘magical’ happens! The ratio between the sizes of the areas of each block or rectangle will follow a set of Fibonacci numbers. These are 1, 1, 2, 3, 5, 8, 13, 21, … and so on. It is basically the last two numbers added together making a sequence. Look at the diagram below. So the ratio of the surface area of the rectangles or squares of the diagram below are: 1:1:2:3:5:8:13:21. If you want to you can take the large block out and you end up with 1:1:2:3:5:8:13. Or only work with the smallest block 1:1:2:3:5. Even 2:1:1 will also work. The larger the number of blocks the more accurate the system.

Fibonacci rectangle and squares and the ratio of surface area between them
Applying the golden rule to economic optimisation
Most farms have a basket of products. If you only have one or two, the theory will not work as the ideal number of different products is 8. Note that long life tomatoes and truss tomatoes are two different products as their marketing strategy, consumer segment and price differ. Just like the demand for green peppers and coloured peppers differ.
To optimize your farm for maximum income, look at the area allocated to each product. Do not include surplus production, just look at how much you can produce per product starting at the smallest highest margin crops.
Let’s build a hypothetical farm with the following selection of potential crops:
- Spring onions
- Spinach
- Baby spinach
- Lettuce
- Cucumbers
- Green peppers
- Red peppers
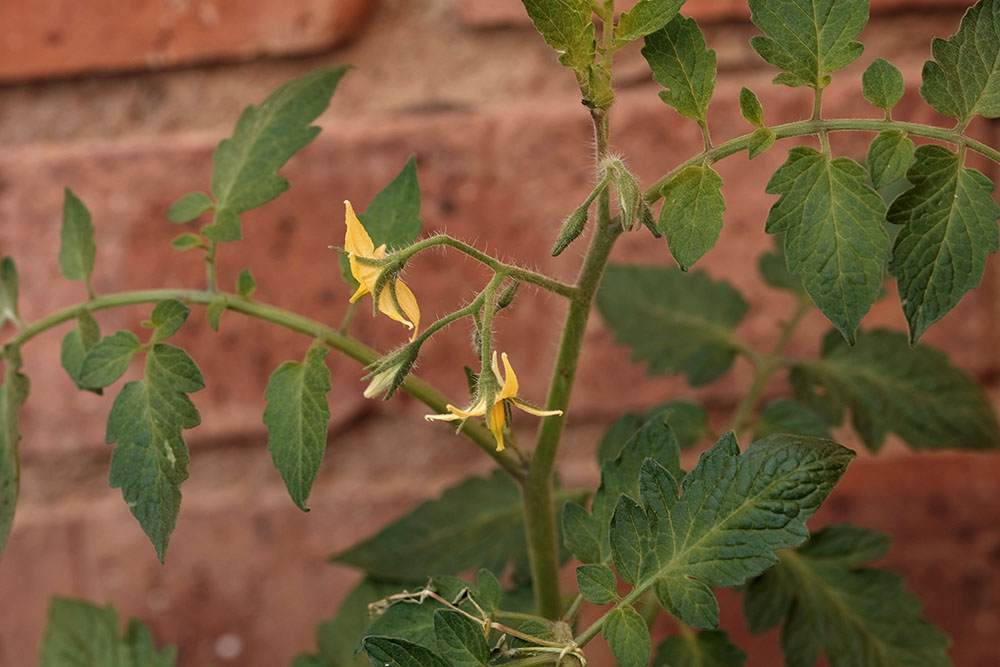
- Tomatoes
Everyone knows that the market demand for tomatoes vs spring onions are not the same. A much larger surface area is allocated to growing tomatoes than spring onions. The same goes for tomatoes vs cucumbers and tomatoes vs green peppers.
Assuming we have 1 ha under hydroponics irrespective of hydroponic system, each block will have the following area:
1: 1 ÷ 54 × 10,000 = 185.19 m² (remember there are two of them)
2: 2 ÷ 54 × 10,000 = 370.37 m²
3: 3 ÷ 54 × 10,000 = 555.56 m²
5: 5 ÷ 54 × 10,000 = 925.93 m²
8: 8 ÷ 54 × 10,000 = 1,481.48m²
13: 13 ÷ 54 × 10,000 = 2,407.41 m²
21: 21 ÷ 54 × 10,000 = 3,888.89 m²
So where does the value 54 come from. Well since we use the Fibonacci sequence from 1-21, the sum of these values is: 1+1+2+3+5+8+13+21=54.
So, the smallest area will be allocated to the most profitable crops but with very little market demand or volume. I would assume it would be spring onions and baby spinach. So, spring onions will have a production area of ± 190 m², and baby spinach too. It might be 180 or 200. The point is it will most likely be close to 185. I have found that parsley is one of the most profitable crops, but try and sell 10 ha of parsley ?.
Now obviously, I have made life very difficult for myself choosing which is the most profitable of the remaining crops;
- Spinach
- Lettuce
- Cucumbers
- Green peppers
- Red peppers
- Tomatoes
But we must look at a couple of factors all at once. Spinach is highly profitable, but not so in high end market sectors compared to rural areas. If you grow spinach for rural markets you are not going to grow it in a very expensive hydroponic system. For that reason, a smaller area will be allocated to spinach than lettuce. We allocate 370.37 m² to spinach and 555.56 m² to lettuce.
Rectangles 5, 8, 13 and 21 must be allocated to the rest of the crops. As there is a large demand for tomatoes, we allocate the crop to rectangle 21. Since cucumbers is more of a speciality crop than peppers and often it is more profitable, peppers are placed on 13 and cucumbers 8. Red peppers is highly specialized and we allocate it to rectangle 5.
| Crop | Rectangle number | Area under production |
|---|---|---|
| Baby spinach | 1 | 185.19 m² |
| Spring onions | 1 | 185.19 m² |
| Spinach | 2 | 370.37 m² |
| Lettuce | 3 | 555.56 m² |
| Red peppers | 5 | 925.93 m² |
| Cucumbers | 8 | 1,481.48m² |
| Green peppers | 13 | 2,407.41 m² |
| Tomatoes | 21 | 3,888.89 m² |
Beware of surplus production
Surplus production is never good. It means you are producing more than what your market needs and that cost of production must be subtracted from your profit. Logically it means that you overall profit margin is lower than expected. Your production must be brought in line with market capacity. In optimization cases, it is better to produce less than too much (that is the theory anyway). If you have a contract to produce a certain amount, it is better to buy in than over produce. The problem is with some contracts specify certain varieties that are not really grown by other producers. In that case produce as much as you can to fulfil your obligations. Rather keep your contract than loose it to a competitor.
What happens to the theory if you only have one crop
Initially I thought the theory does not apply. After a good night sleep, it struck me. If you have only one crop, for instance cucumbers, I am sure you have different markets or packaging. So assuming you have 5 different packaging styles your ratio’s will be: 1:1:2:3:5. For example:
- 5000 cucumbers packed in boxes with 30 cucumbers
- 3000 cucumbers packed in boxes with 20 cucumbers
- 2000 cucumbers packed in boxes with 15 cucumbers
- 1000 cucumbers packed in loose
- 1000 cucumbers packed in bags
You can add your own packing styles, above are just samples. But the point is it is highly likely that the ratio in which you are packing your cucumbers will follow these ratios, it might not be in the first year or so, but over a period the ratio gets more accurate.
How to calculate the total surface area according to the ratios
If you want to calculate the total surface area of your farm according to the ratio of the squares just follow the instructions below.
First you need to know how many crops you have, or how many packaging styles you have. Let’s assume 5. So your sequence must be 1, 1, 2, 3, 5. The common denominator (or sum of numbers) is 1+1+2+3+5=12. Let’s assume your hydroponic farm is 1500 m².
Calculating any area, use the following formula:

The first two small areas with ratios 1:

The third area with ratios 2:

The fourth area with ratios 3:

The fifth area with ratios 5:

Total area should be 1500 m²: 125+125+250+375+325 = 1500
Conclusion
There is no need to explain the theory using the rectangles, but it does help visualising the principle. It is a physical thing, not just theory. I don’t think one should spend too much time over analysing your business to test if it fits these ratios, but you never know. If something is not working right, have a look and see if you cannot change the ratios of various products. It just might be that you are over supplying in one area and missing out on another with higher profit margins.
I really believe there is some order that can be found in these numbers. Just like we follow the 80:20 and 90:10 principles as well as the Bell curve, Fibonacci numbers can be applied in the real world. Although they might not match perfectly, they do provide a check against the relative ratio or order of various aspects of our business.
References
- 1https://commons.wikimedia.org/wiki/File:Golden_Ratio.png
Related Posts


Share This Story, Choose Your Platform!


What affects water quality in hydroponics?
The main factors affecting water quality in hydroponics are chemical, biological, and physical/environmental conditions. Maintaining optimal water quality is essential [...]
Why Water Quality Matters More Than You Think in Hydroponics
What is the ideal water quality for hydroponics. The answer is going to be very fluffy but one thing is [...]
References
- 1https://commons.wikimedia.org/wiki/File:Golden_Ratio.png